How I learned to stop worrying and start pinging
We have regular hackathons to experiment with new fields/technology. We decided to write blogs on any shippable product that we created during the hackathon. This blog is first in the series, where we created an app that creates status pages.
Introduction
What is a Status Page?
Almost all organizations have a page where you can view the status (or uptime) of their services. For example, this is the SDSLabs Status page: https://statusv2.sdslabs.co/. A webpage that displays the uptime/downtime statistics of its services is called a status page.
Why do you need it?
A status page tells you whether an application is up or not. Suppose your Facebook notifications just stopped working. You might start to fiddle with the settings on your phone, but it may be that the Facebook servers that send notifications are down. A status page tells you exactly that. It is also pretty useful for companies too, making them aware of the downtime before a user has a chance to complain.
What did we make?
We made a web application that creates these status pages. Many others provide the same service, such as Freshping, Apex Ping, and Atlassian Statuspage. However, these services are either paid or provide limited free access. Moreover, there are no open-source alternatives to them. So, we made one on our own (and yes it’s going to be open-source).
Developing
Architecture
A status page consists of many services where it needs to check whether the service is working or not. However, what do we mean by the phrase “the service is working”? Usually, you ping the host, and if you receive a reply, the host server is up else it’s down. However, ping only tells you if your request can reach the server. The code may or may not function properly. For that, more parameters need to be checked, say, the status code of the response. A “200” status means your page is working fine, but any other status means you need to fix some issues.
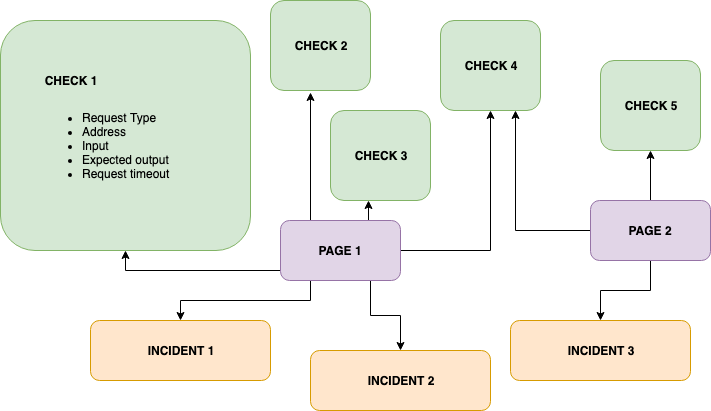
Seeing that there might be so many parameters, we defined an abstraction called a Check. A check consists of the URL of the request, type of request, expected output, and any input sent by the user. For each kind of request, there are a limited number of request types and output types and correspondingly their values.
A page might contain some (and not all checks created by the user). A user might create multiple pages (each having a different set of checks). A page also needs to display any incidents that happened and if they were fixed or not. The app also has a feature to add collaborators to your page.
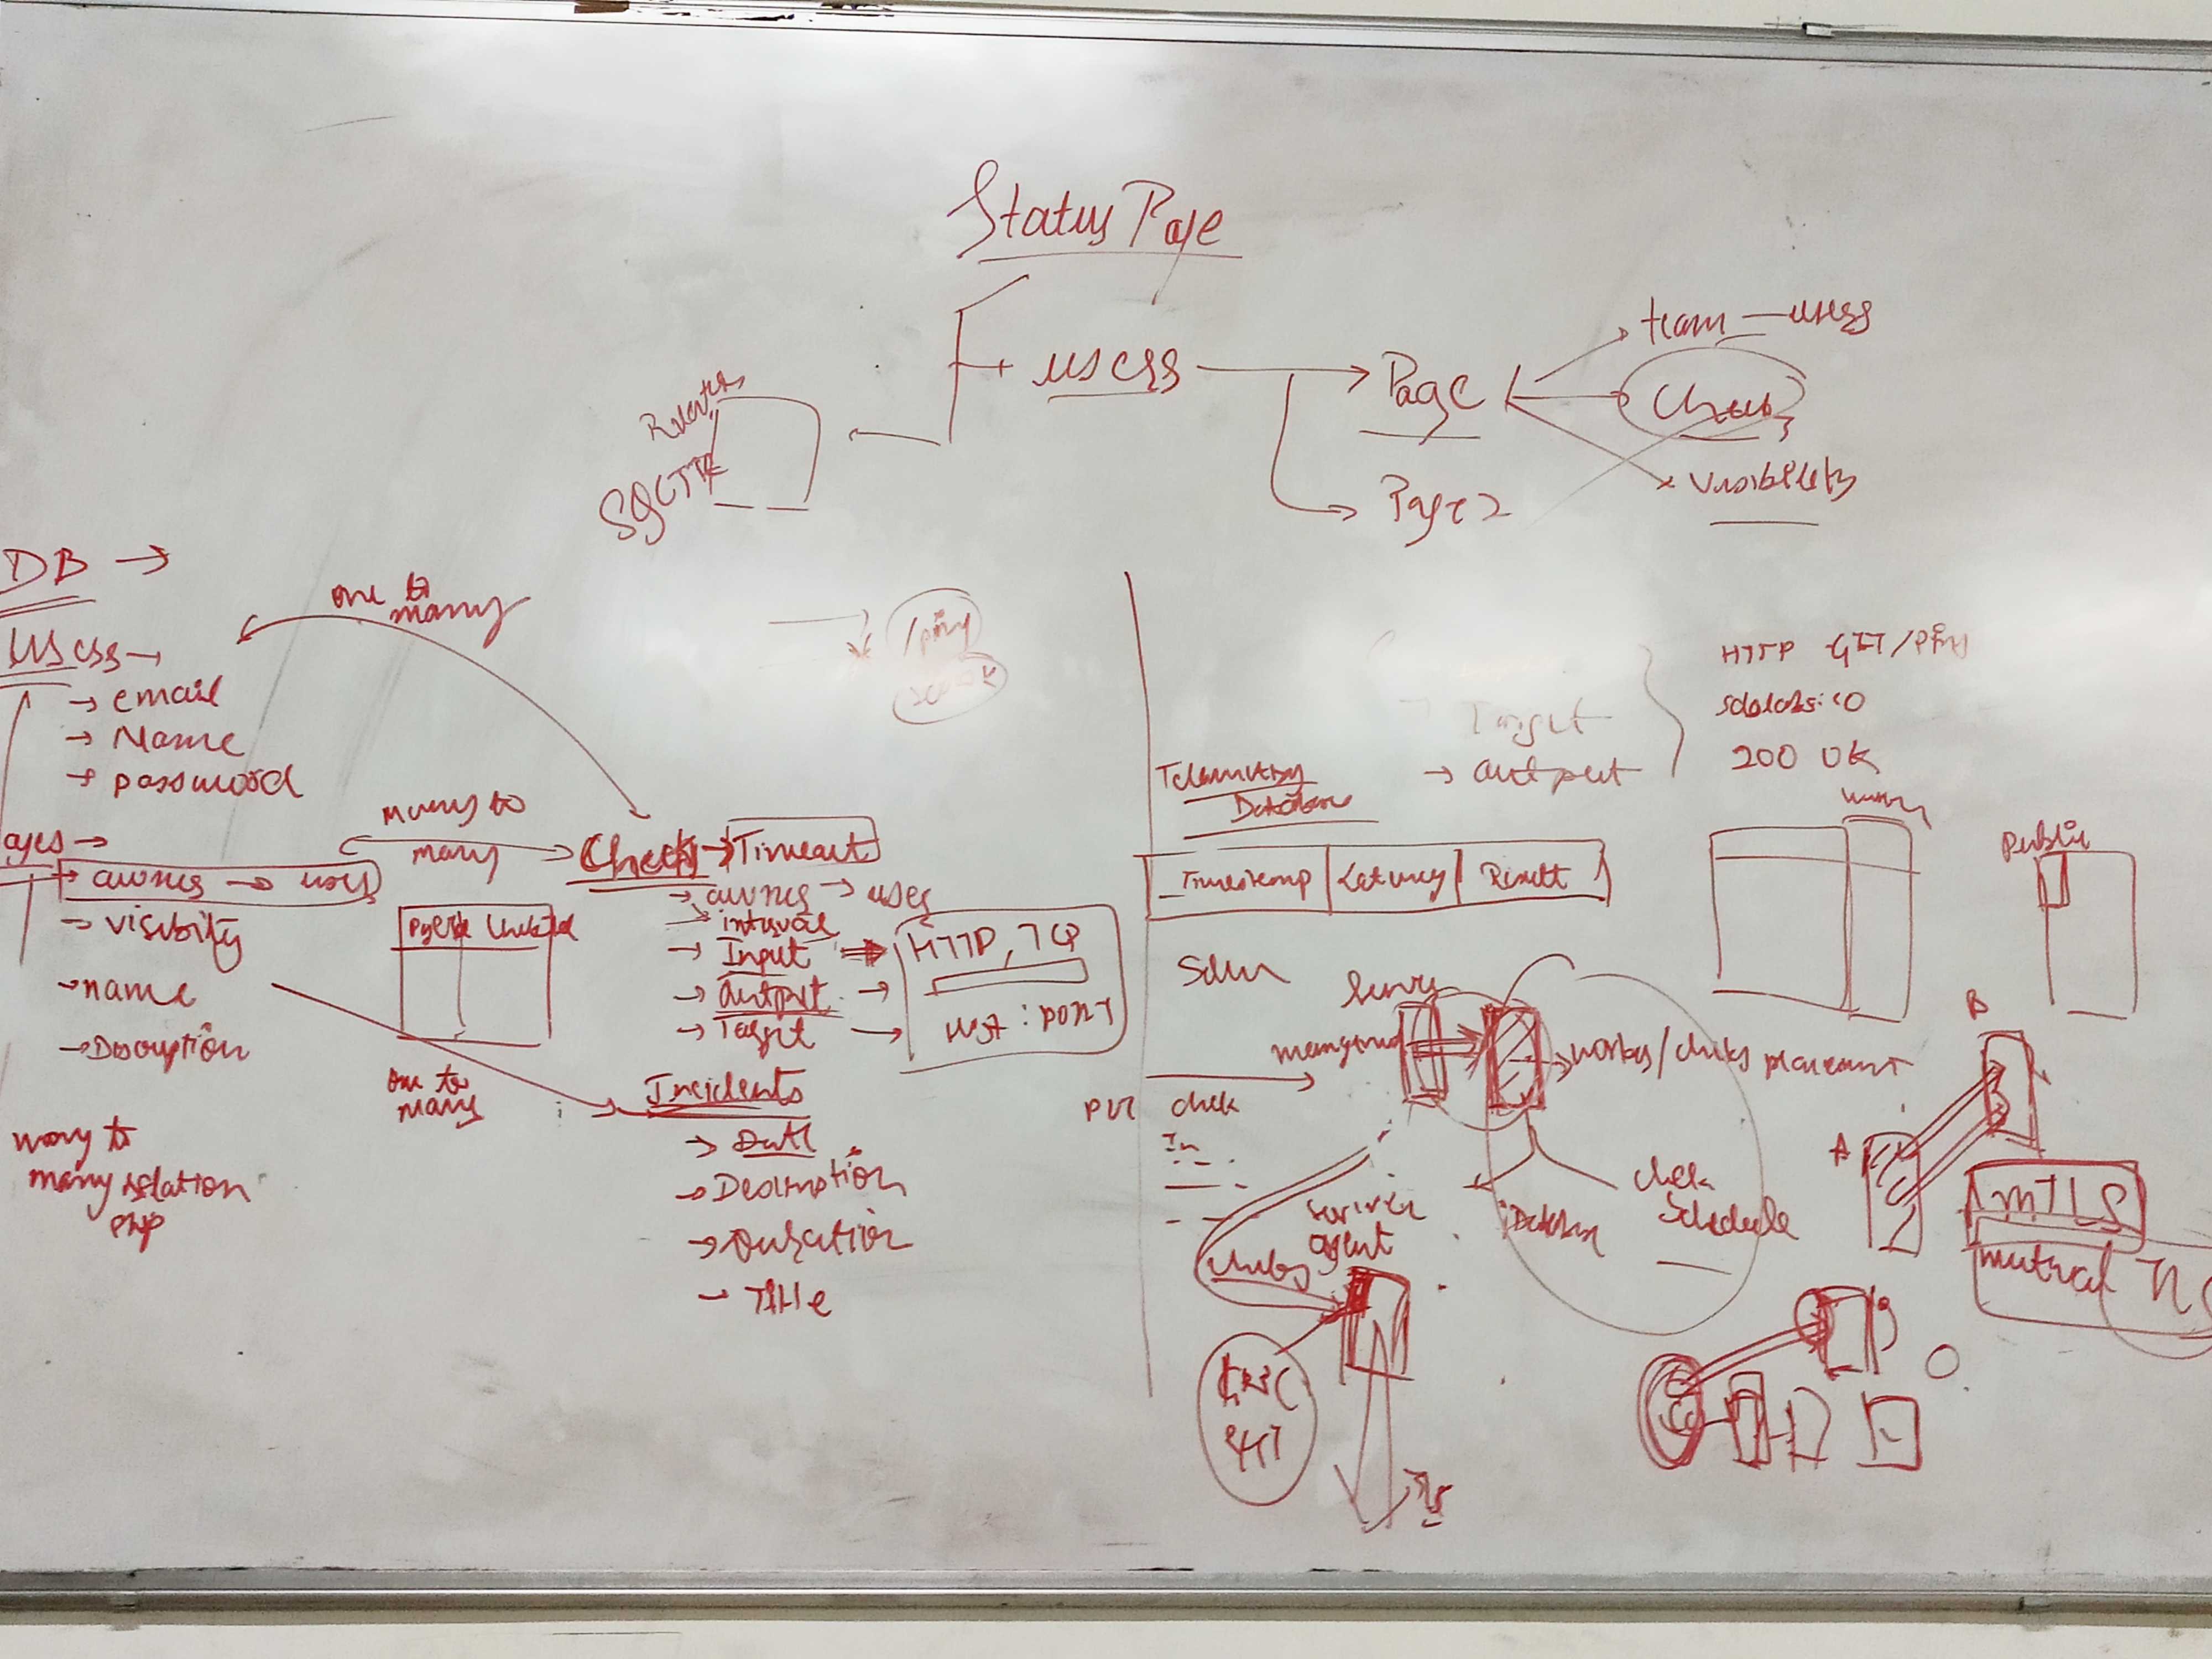
The diagram below illustrates the schema of the Database.
The biggest challenge in making the app was implementing how the checks would work. Since a user can request to check for uptime every 30 seconds, assuming a large scale, it’s unreasonable to expect one server to handle everything correctly. So we wanted the app to be scalable over multiple servers.
For this, we first thought of deploying a container for every check. We schedule this container in any of the nodes defined by us. Soon, we rejected the idea, given that there can be way too many checks and you cannot have a container dedicated to a check.
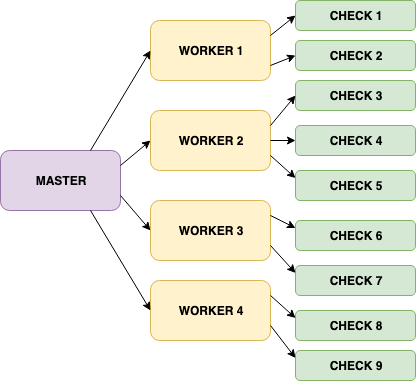
The next solution had a master that assigns checks to workers. The worker schedules the checks. Now, these workers can be scaled horizontally. This architecture was a much better optimization as compared to the previous solution.
There were some solutions that we thought about optimizing the process of scheduling the checks too, but each of them imposed some limitations on the functionality of the app (like limiting the choices of the interval of sending requests or increasing the minimum interval time after which we can send a request). Sacrificing functionality for the sake of minor optimizations was unacceptable.
Finally, we needed to manage the lifecycle of the workers. It’s relatively complex when managing containers across multiple nodes (servers). We chose to rely on Kubernetes than reinventing the wheel ourselves. Kubernetes allows you to create custom resource objects. We need to write the code that handles assigning of checks in various workers for multiple events, such as, when adding or removing a worker from the cluster and let Kubernetes handle the rest.
Due to a limited number of resources, first, we’re going to release a version without the described Kubernetes architecture. For the initial release, we’re aiming at an app which can spawn and manage workers on a single server.
Tech Stack
We chose Golang since it’s a compiled language and all my team members were comfortable with writing code in Go. Go being a compiled language was helpful because we could create binaries of agents that would run on worker containers. It’s also much easier to write as compared to C/C++.
Along with it, we used Docker Containers, and as mentioned above, Kubernetes for managing their lifecycle.
For storing metrics of the statuses, we needed a time-series database. Struggling between Prometheus and InfluxDB, we found out about TimescaleDB. It’s an extension of PostgreSQL, so anything that works with Postgres works well with Timescale too. There were even more benefits to this since we did not want to write queries specifically for InfluxDB, and Prometheus being a pull-based DB did not fit our needs. With Postgres, we could use a single database for both metrics and meta-data.
Many people don’t require all this functionality and just the metrics for a few checks. So there’s even a stand-alone mode where you can write a simple YAML file defining properties of checks, and it’ll do the job. Also, integrating with Prometheus was an easy job, so for the stand-alone user can plug in Prometheus too.
Hackathon
Organizing an internal hackathon turned out to be productive. Usually, the part of the process that takes much time gets completed in a matter of hours. It’s also encouraging to see everyone else around you working with such enthusiasm. It’s exciting to see all the products that others make in the end.
We had a formal presentation of the work everyone completed in two days. The winner was also awarded a prize from the final year. The best part was this being an internal hackathon, and we could decide the parameters for rating. So, we did include code quality as well as the number of hours spent on working on the project.
We finished most of the app during the weekend. There’s still some work left to ship the complete product (at least a version that works flawlessly with minimal functionality). You’ll hopefully see it on Github soon :)